We were thinking that this stretch of roadway was only flooding a couple of times per year, but once we installed the Hohonu sensor we found out that it flooded about 50 times between January and the first part of the summer, which was quite remarkable.
- Chris Gloninger, Senior Climate Scientist, Woods Hole Group
The Story
Great Island’s only access road was thought to flood just a few times a year. Woods Hole Group installed a Hohonu sensor in less than 2 hours, which now streams minute-level, centimeter-accurate water levels. The data showed ~50 flood events (Jan–early summer), giving Yarmouth FD and the community real-time alerts and the evidence to plan for both near-term emergencies and long-term adaptation.
1
Critical access road instrumented
50
Flood events detected (Jan–early summer)
24/7
Real-time monitoring & alerts
Problem
-
Single access at risk: Great Island Road is the only way in/out and was getting overtopped with no reliable record of how often or how long.
-
Reactive response: Teams had to scout first before calling resources; no real-time visibility to pre-stage or reroute.
-
Evidence gap: Needed quantitative, defensible data (frequency, duration, magnitude) to guide emergency ops and resilience design.
Stakeholders
-
Great Island Homeowners Association — Community sponsor & use-case owner
-
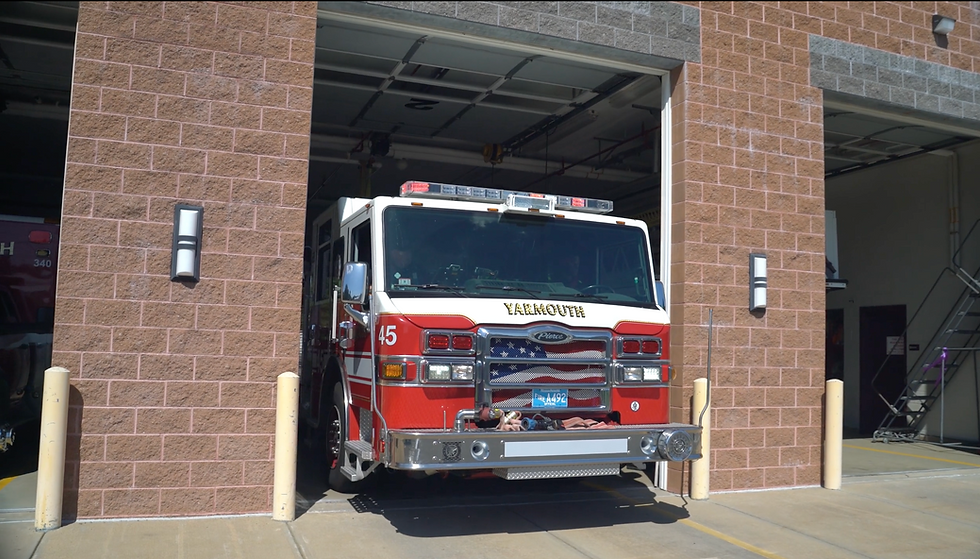
Yarmouth Fire Department / Emergency Management — Response planning & operations
-
Woods Hole Group — Science/technical advisor on siting & feasibility
-
Residents & visitors — Access, safety, and travel planning
Solution
Outcomes
-
Reality check: Sensor revealed ~50 flooding events in ~6 months (vs. “a couple per year”), reframing urgency.
-
Operational wins: Advance notice & live monitoring to pre-stage resources, protect assets, and reroute safely.
-
Planning leverage: Credible time-stamped data now informs feasibility, design, funding, and policy decisions.
Solution
-
Rapid install: Hohonu gauge deployed in hours (incl. travel), delivering cm-level, minute-average water levels to the cloud.
-
Live dashboards & alerts: Simple app the team uses daily for situational awareness and incident response.
-
Shared visibility: Data accessible to the community and partners, creating a common operating picture for decisions.